Not all of the work I do is visual, super exciting, or even billable (hello administrative paperwork!), but I would be remiss if I didn’t share a few of the projects I’ve worked on lately…
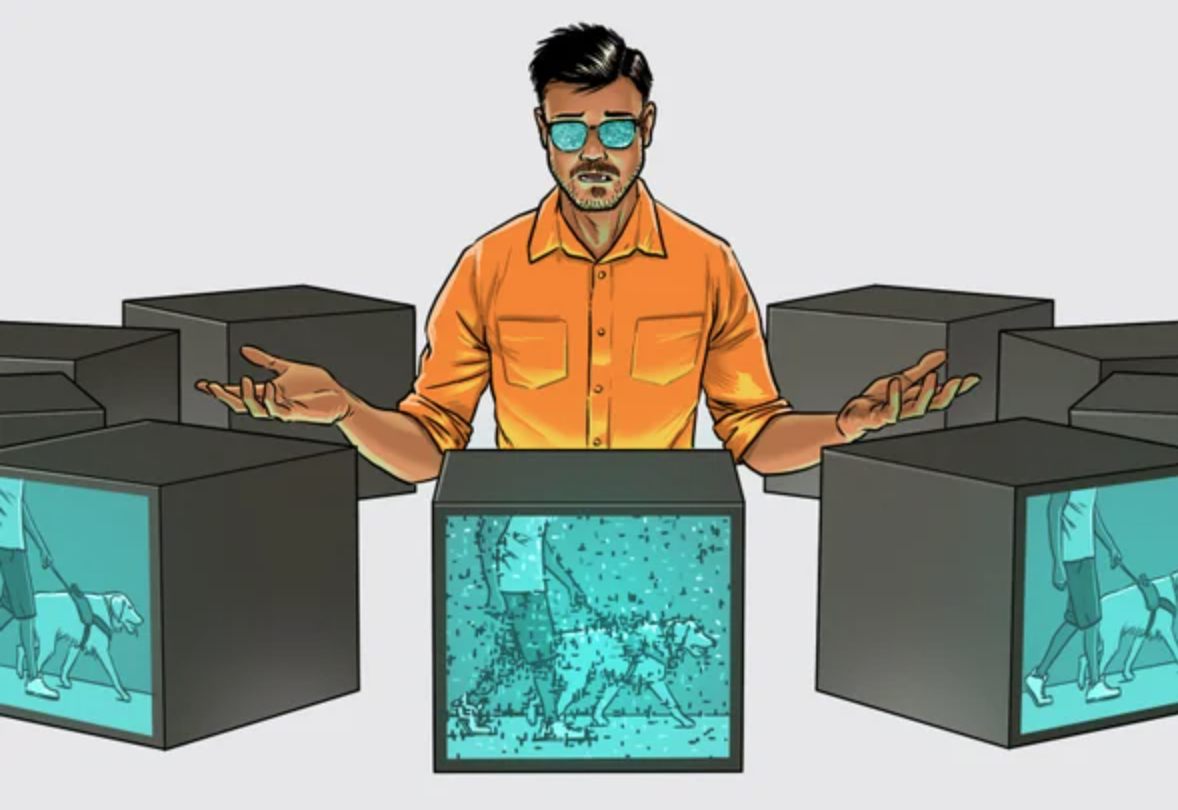
Last year, Scientific American asked me to dig in to how researchers decoded ancient Herculaneum scrolls—badly damaged and disfigured by the eruption of Mount Vesuvius in C.E. 79—by using advanced imaging technologies and machine learning.

Scientific American magazine, April 2024. Click here for the online article.
Matthew Twombly; Christy Chapman/U. of Kentucky and Stephen Parsons/Vesuvius Challenge (consultants); Amanda Hobbs
For National Geographic, I spent months researching Amazonian ecosystems, interviewing experts, and collaborating with a team of super talented folks to put together two information graphics: Life in the Headwaters and Predators of the Amazon.

National Geographic magazine, October 2024. Reproduced with permission.
Monica Serrano, Amanda Hobbs, and Eve Conant, NGM Staff. Art: Matt Twombly


National Geographic magazine, October 2024. Reproduced with permission. Explore the interactive version of the special issue here.
Graphics by Fernando G. Baptista, Lawson Parker, Eve Conant, Amanda Hobbs, and Liz Sisk, NGM Staff.
To mark the occasion of the reopening of Notre Dame, I worked with Fernando Baptista to develop four pages of fold-out graphics detailing the rebuilding and modern updates for the December 2024 issue of National Geographic. Researching the centuries-old cathedral was a delight for this history major. From the architecture and engineering to the artwork and religious relics—Notre Dame is chock-full of stories to tell (including more than a few secrets and surprises).


National Geographic magazine, December 2024. Reproduced with permission.
Fernando G. Baptista and Amanda Hobbs.
More recently, I studied the biology, environmental impact, and all around COOLNESS of the under-appreciated beaver. Industrious creatures, beavers shape the world around them to suit their needs, but in doing so improve the habitat for a whole hose of plants and animals.

National Geographic magazine, June 2025. Reproduced with permission.
Fernando G. Baptista, Soren Walljasper, and Amanda Hobbs.
Then, if science, technology, archaeology, architecture, and wildlife ecology weren’t enough topics for one brain to manage, I also looked into the environmental impact of the fashion industry and how we, as consumers, can make better choices. Check out “How to Be a Smarter Fashion Consumer in a World of Overstated Sustainability” in the July/August issue of Scientific American.

Scientific American magazine, July/August 2025.
By Laila Petrie, Jen Christiansen & Amanda Hobbs. Edited by Jen Schwartz & Jen Christiansen